“Opportunistic Buying” as Bitcoin Enters Low-Liquidity Zone: Glassnode

After peaking at over $123,000 in mid-July, Bitcoin BTC $116 345 24h volatility: 2.0% Market cap: $2.32 T Vol. 24h: $29.36 B has entered into a phase of market indecision. At press time, the price hovers just above $115,000, down roughly 3% in the last seven days.
According to Glassnode, the breakdown from the $116,000 support zone on July 31 pushed BTC into a low-liquidity “air gap,” with little historical buying activity between $110,000 and $116,000.
Data reveals that opportunistic buyers accumulated around 120,000 BTC during a bounce between $112,000 and $114,000. However, analysts caution that this short-term activity is insufficient to establish durable support.
~120k $BTC were acquired during the rebound from $112k to $114k – evidence of opportunistic buying. Yet supply within the $110k–$116k range remains sparse, meaning stronger accumulation is needed to form lasting support: https://t.co/1J8WjAFubu pic.twitter.com/vL4OL3hOlg
— glassnode (@glassnode) August 7, 2025
Short-term holders, those who bought BTC within the last 155 days, are seeing profits shrink. Their profitability has dropped from 100% to just 70%, a sign that confidence may weaken without strong demand and massive accumulation.
The current short-term holder cost basis lies around $106,000, still below the current market price but inching closer.
On-chain data also shows that large Bitcoin whale wallets booked over $44.5 million in profits over the past 48 hours, signaling a wave of sell-side activity.
Long-term Bitcoin $BTC holders booked roughly $44.5 million in profits in the last 48 hours! pic.twitter.com/KN4tu7znVT
— Ali (@ali_charts) August 7, 2025
Despite this cautious sentiment, experts remain optimistic with the Crypto Fear & Greed Index sitting in the “Greed” zone. Fundstrat’s Tom Lee recently stated that Bitcoin is still the top crypto to buy and projected a $250,000 BTC price target for 2025.
BTC Price at a Crossroads
On the 4-hour BTC chart, Bollinger Bands indicate tightening volatility, with price attempting to break above the mid-band (20 SMA) around $115,355.
A sustained move above the upper band near $115,750 could lead the cryptocurrency to the $118,000 resistance level.
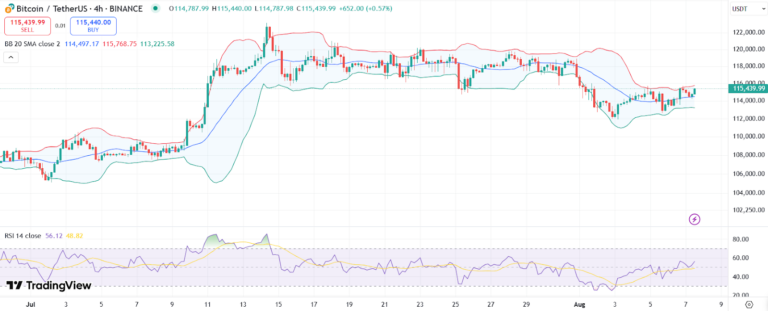
BTC price chart with RSI and Bollinger Bands | Source: Trading View
However, rejection at the band could lead to renewed downward pressure, with a weak support around the lower band at $112,000.
The RSI is suggesting a neutral-to-slightly bullish momentum with enough room for upward movement if volume picks up.
The MACD indicator shows a possible bullish crossover forming, though the signal remains early. If the MACD line breaks above the signal line with increasing green bars, upward momentum could follow. A breakout past $118,200 would signal renewed bullish strength.
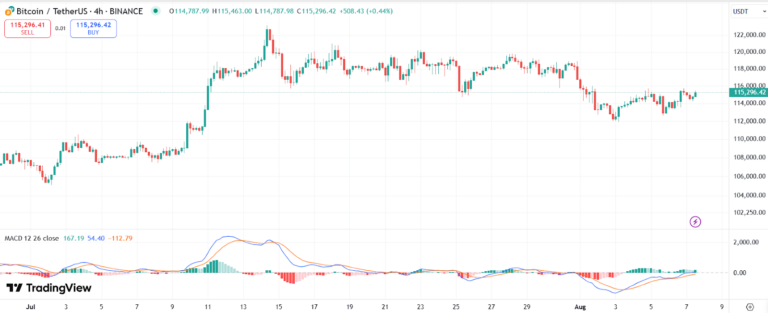
BTC price chart with MACD | Source: Trading View
The post “Opportunistic Buying” as Bitcoin Enters Low-Liquidity Zone: Glassnode appeared first on Coinspeaker.
Read More

Crypto Market Sentiment Shifts: BTC, ETH, XRP on Investors’ Radar

Robert Kiyosaki: Bitcoin Is Pure Genius Asset Design
“Opportunistic Buying” as Bitcoin Enters Low-Liquidity Zone: Glassnode
After peaking at over $123,000 in mid-July, Bitcoin BTC $116 345 24h volatility: 2.0% Market cap: $2.32 T Vol. 24h: $29.36 B has entered into a phase of market indecision. At press time, the price hovers just above $115,000, down roughly 3% in the last seven days.
According to Glassnode, the breakdown from the $116,000 support zone on July 31 pushed BTC into a low-liquidity “air gap,” with little historical buying activity between $110,000 and $116,000.
Data reveals that opportunistic buyers accumulated around 120,000 BTC during a bounce between $112,000 and $114,000. However, analysts caution that this short-term activity is insufficient to establish durable support.
~120k $BTC were acquired during the rebound from $112k to $114k – evidence of opportunistic buying. Yet supply within the $110k–$116k range remains sparse, meaning stronger accumulation is needed to form lasting support: https://t.co/1J8WjAFubu pic.twitter.com/vL4OL3hOlg
— glassnode (@glassnode) August 7, 2025
Short-term holders, those who bought BTC within the last 155 days, are seeing profits shrink. Their profitability has dropped from 100% to just 70%, a sign that confidence may weaken without strong demand and massive accumulation.
The current short-term holder cost basis lies around $106,000, still below the current market price but inching closer.
On-chain data also shows that large Bitcoin whale wallets booked over $44.5 million in profits over the past 48 hours, signaling a wave of sell-side activity.
Long-term Bitcoin $BTC holders booked roughly $44.5 million in profits in the last 48 hours! pic.twitter.com/KN4tu7znVT
— Ali (@ali_charts) August 7, 2025
Despite this cautious sentiment, experts remain optimistic with the Crypto Fear & Greed Index sitting in the “Greed” zone. Fundstrat’s Tom Lee recently stated that Bitcoin is still the top crypto to buy and projected a $250,000 BTC price target for 2025.
BTC Price at a Crossroads
On the 4-hour BTC chart, Bollinger Bands indicate tightening volatility, with price attempting to break above the mid-band (20 SMA) around $115,355.
A sustained move above the upper band near $115,750 could lead the cryptocurrency to the $118,000 resistance level.
BTC price chart with RSI and Bollinger Bands | Source: Trading View
However, rejection at the band could lead to renewed downward pressure, with a weak support around the lower band at $112,000.
The RSI is suggesting a neutral-to-slightly bullish momentum with enough room for upward movement if volume picks up.
The MACD indicator shows a possible bullish crossover forming, though the signal remains early. If the MACD line breaks above the signal line with increasing green bars, upward momentum could follow. A breakout past $118,200 would signal renewed bullish strength.
BTC price chart with MACD | Source: Trading View
The post “Opportunistic Buying” as Bitcoin Enters Low-Liquidity Zone: Glassnode appeared first on Coinspeaker.
Read More
Crypto Market Sentiment Shifts: BTC, ETH, XRP on Investors’ Radar